
About Us | Insights | Careers | Industries |

Data Analytics & Business Intelligence Solutions

Turn business data into clear dashboards, automated reports and actionable insights that help your team make faster and smarter decisions.

Data Analytics Solutions
Overview

Turn Business Data into Clear Decisions

T3 Consulting helps businesses collect, organize, analyze and visualize data from multiple sources such as CRM, ERP, Excel sheets, sales systems, finance tools and operational platforms.

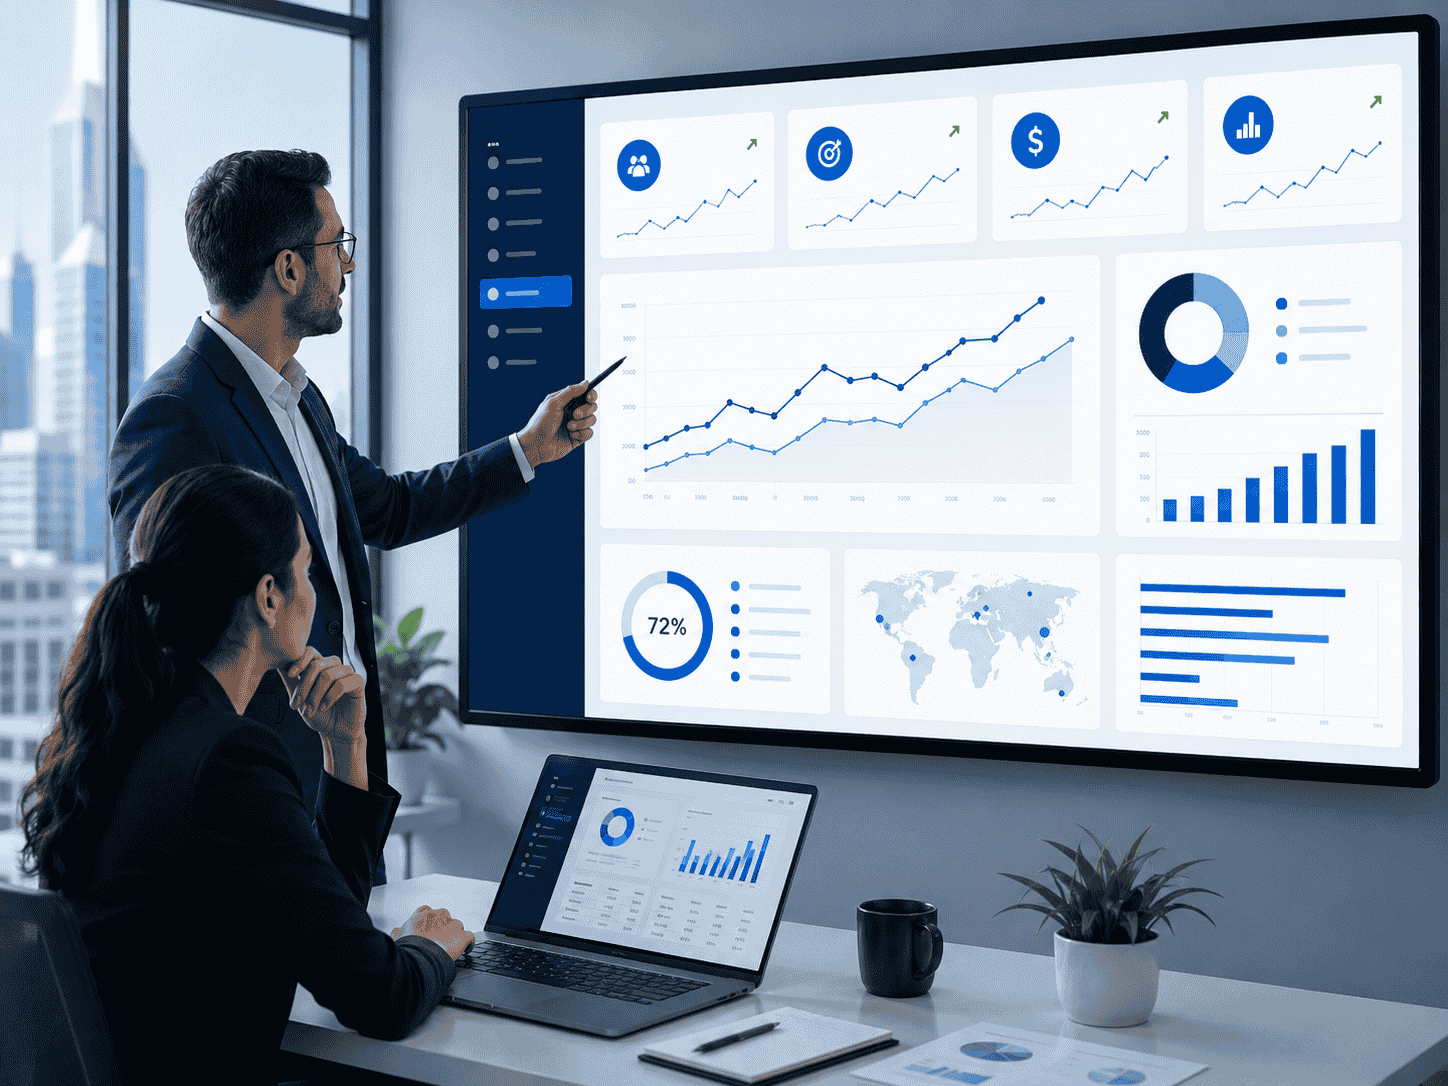
Our data analytics and business intelligence solutions help management teams track KPIs, reduce manual reporting, identify trends, improve visibility and make faster data-backed decisions.

Data Analytics BI Dashboards KPI Tracking Reporting Automation Data Visualization
What We Offer

Our Data Analytics Capabilities

Business Intelligence Dashboards

Create interactive dashboards to monitor sales, finance, operations, inventory, customers and business performance.

Data Visualization

Convert complex data into simple charts, graphs and visual reports that are easy for teams to understand.

Data Integration

Connect data from CRM, ERP, Excel sheets and business systems into one reliable reporting source.

Automated Reporting

Generate daily, weekly and monthly reports automatically to reduce manual work and improve accuracy.

KPI Performance Tracking

Track key business metrics in real time and identify gaps, trends and improvement areas quickly.

Management Reporting

Provide leadership with clear reports and dashboards for faster planning, reviews and decision-making.

Why It Matters

Why Data Analytics Matters for Business Growth

Without clear data, teams depend on manual reports, assumptions and delayed updates. Data analytics gives your business real-time visibility into performance, customer behavior, sales trends, operational gaps and growth opportunities.

With accurate dashboards and automated reporting, decision-makers can act faster, reduce reporting delays and focus on the areas that directly impact revenue, efficiency and customer experience.

Track Performance Clearly

Monitor KPIs, business progress and department performance with real-time dashboards.

Find Growth Opportunities

Understand sales trends, customer behavior, demand patterns and business performance gaps.

Save Reporting Time

Reduce manual Excel work through automated reporting and centralized business dashboards.

Improve Business Visibility

Give management one clear view of sales, operations, finance, customers and team performance.

Data Analytics Business Impact
Our Methodology

Our Data Analytics Implementation Process

A practical consulting-led process to understand your data sources, structure information, build dashboards and continuously improve reporting accuracy.

01
Understand Data

Study your business process, existing data sources, reporting needs, and key performance indicators.

02
Structure Data

Clean, organize, and connect data from different systems into a reliable analytics-ready format.

03
Build Dashboards

Create visual dashboards, reports, filters, and analytics views based on business requirements.

04
Improve Insights

Continuously enhance reports, add new KPIs, and optimize dashboards as your business grows.

Ready to Make Smarter Decisions with Data?

Book a consultation with T3 Consulting to build dashboards, automate reports and turn your business data into meaningful insights.